Use test pipeline
In subsection Use web interface, the electronic archive introduced in Introduction was accessed. The electronic archive offers a HTTP interface and therefore HTTP requests were issued. We had to take care to provide the right HTTP headers along with the message we wanted to pass (header “Content-Type”). In general, satisfying the requirements of the interface can sometimes be complicated.
This subsection explains an alternative way to access the System Under Test, the Test Pipeline screen of the Frank!Framework. This way, you skip the interface of your Frank adapter (the HTTP interface of the electronic archive) and pass your message directly to the business logic.
This subsection also shows you that you can filter the table at the top of Ladybug, although this is not investigated here in detail.
Please call the the electronic archive as follows:
Ensure that the Frank!Framework is set up according to Preparations and that it is running. Go to Ladybug. Ensure that the report generator is enabled. See Windows or Linux.
Click “Testing”:
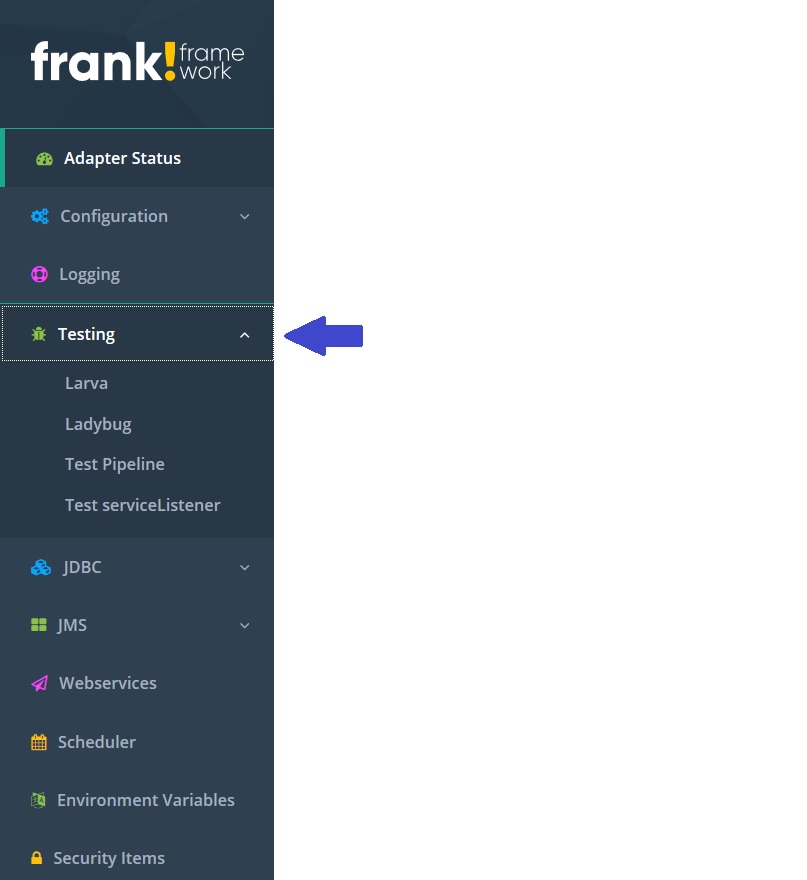
Click “Test Pipeline”. The following screen appears:
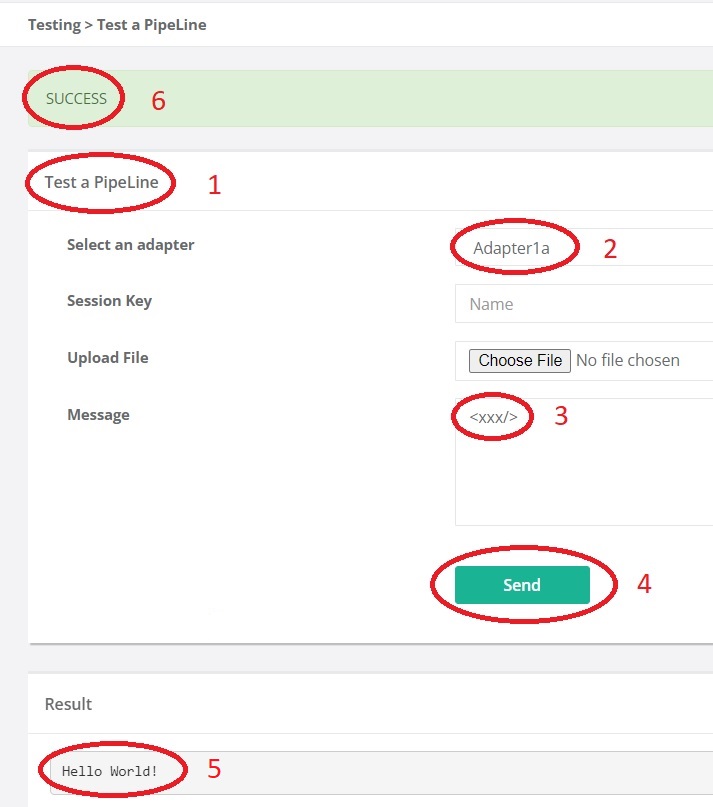
Select adapter “sutGet” (number 1)
Note
The abbreviation SUT stands for “System Under Test”.
Enter the following text in the message field (number 2):
<docid>docid-12345</docid>
Press “Send” (number 3).
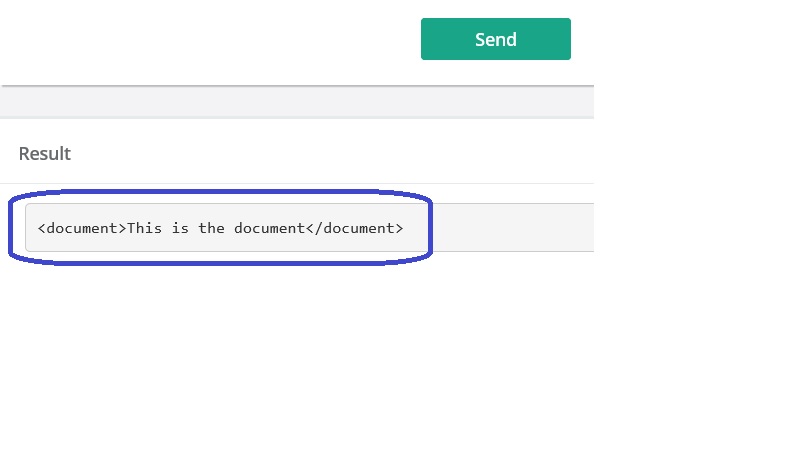
The result is shown below the send button:
Note
This result is fixed as motivated in Introduction.
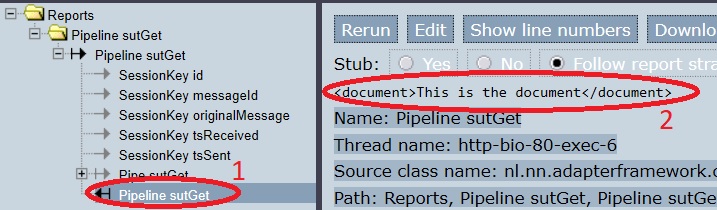
Go back to Ladybug and press Refresh (number 1 in the figure below). You see a table in which your call to “sutGet”appears (number 3).
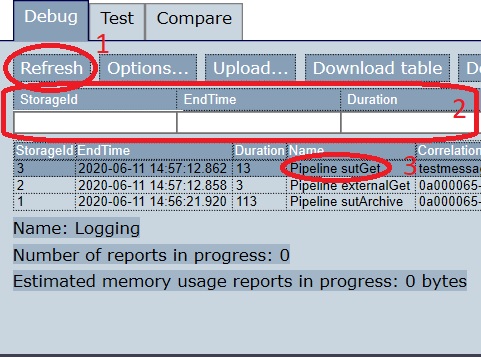
Above the table, you see a row of text fields with labels (number 2). You can use these for filtering the Ladybug table. This is useful if you have many test reports. By filtering, you can restrict the number of rows such that you can find the row you want. To investigate this, please hover over this area and read the tooltip texts.
Please continue as follows:
Click the line corresponding to your call to adapter “sutGet”. To the bottom left, you see a tree view of the execution of this Frank adapter (number 1). To the right, you see information about the selected node (number 2). In this case, it is the output XML message you saw before after pressing “Send” in Test Pipeline.